biapy.utils.util
This module provides a collection of utility functions for image processing, data manipulation, and visualization, primarily geared towards bioimage analysis workflows.
It includes functionalities for:
Generating plots for training loss and metrics.
Creating threshold-based metric plots.
Generating weight maps for U-Net-like models to handle object boundaries.
Organizing images into class-specific folders based on foreground percentage.
Visualizing learned filters of convolutional layers.
Ensuring image dimensions are divisible by a given factor for downsampling.
Converting segmentation masks to affinity graphs (for 3D data).
Validating and reshaping image volumes.
Implementing im2col for patch extraction.
Widening segmentation borders.
Calculating SHA256 checksums for files.
- biapy.utils.util.create_plots(results, metrics, loss_names, job_id, chartOutDir)[source]
Create loss and main metric plots with the given results.
This function visualizes the training and validation loss, as well as training and validation values for each given metric across epochs. Plots are saved as PNG images in the specified output directory.
- Parameters:
results (Dict) – A dictionary containing training history. Expected keys are ‘loss’, ‘val_loss’ (optional), and entries for each metric (e.g., ‘jaccard_index’) and its validation counterpart (e.g., ‘val_jaccard_index’).
metrics (List[str]) – A list of metric names (e.g., [“jaccard_index”, “f1_score”]) present in results.
loss_names (List[str]) – A list of loss function names (e.g., [“loss”, “loss_discriminator”]) present in results.
job_id (str) – A unique identifier for the job, used in plot titles and filenames.
chartOutDir (str) – The directory where the generated chart images will be stored.
Examples
>>> # Assuming 'results' is a dictionary like:
>>> # {'loss': [...], 'val_loss': [...], 'jaccard_index': [...], 'val_jaccard_index': [...]}
>>> # create_plots(results, ['jaccard_index'], 'my_experiment', './charts/')
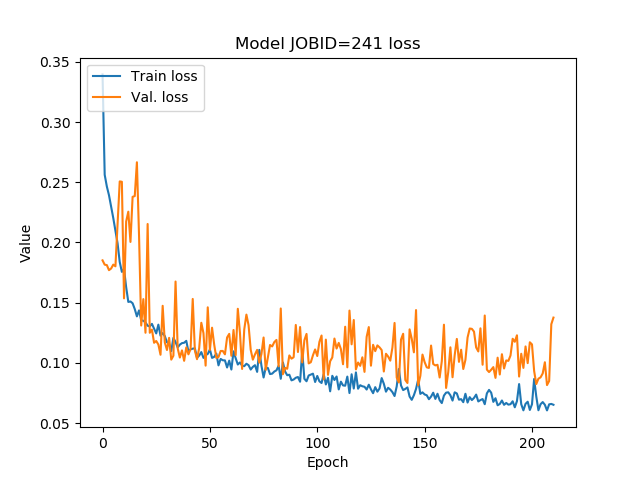
Loss values on each epoch
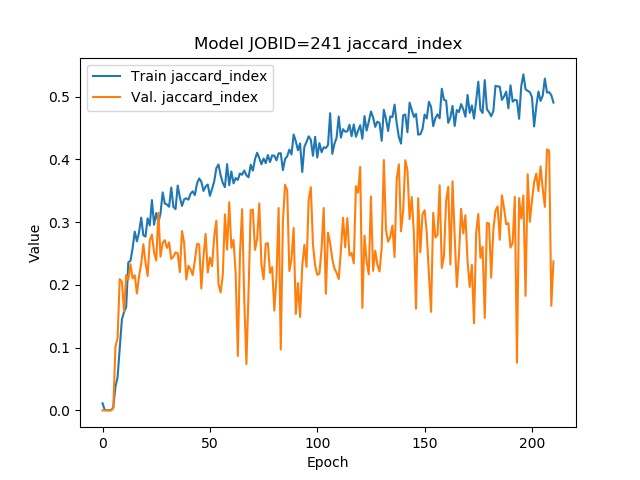
Jaccard index values on each epoch
- biapy.utils.util.threshold_plots(preds_test, Y_test, n_dig, job_id, job_file, char_dir, r_val=0.5)[source]
Generate plots showing metric values (e.g., Jaccard index) across different binarization thresholds applied to predictions.
The predictions are binarized using thresholds from 0.1 to 0.9 (inclusive, step 0.1). For each threshold, the Jaccard index is calculated against the ground truth. A plot is generated visualizing these metric values.
- Parameters:
preds_test (NDArray) – Predictions made by the model, typically a 4D NumPy array of shape (num_of_images, y, x, channels) with float values.
Y_test (NDArray) – Ground truth masks, typically a 4D NumPy array of shape (num_of_images, y, x, channels) with integer labels.
n_dig (int) – The number of digits used for encoding temporal indices (e.g., 3). This parameter seems to be a remnant from a previous use case (DET calculation binary) and might not be directly used in the current function’s logic, but kept for compatibility.
job_id (str) – Identifier for the job.
job_file (str) – Combined identifier for the job and run number (e.g., “278_3”), used in filenames.
char_dir (str) – Path to the directory where the generated charts will be stored.
r_val (float, optional) – A specific threshold value (between 0.1 and 0.9) for which the Jaccard index will be returned. Defaults to 0.5.
- Returns:
The Jaccard index value obtained when binarizing predictions with the r_val threshold.
- Return type:
float
Examples
>>> # Assuming preds_test and Y_test are loaded NumPy arrays
>>> # t_jac_at_0_5 = threshold_plots(preds_test, Y_test, 3, 'my_job', 'my_job_run1', './threshold_charts/', r_val=0.5)
Will generate one chart for the IoU. In the x axis represents the 9 different thresholds applied, that is:
0.1, 0.2, 0.3, ..., 0.9. The y axis is the value of the metric in each chart. For instance, the Jaccard/IoU chart will look like this: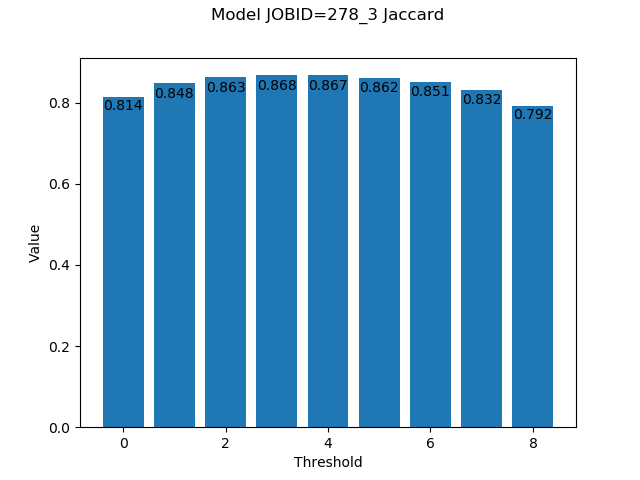
In this example, the best value,
0.868, is obtained with a threshold of0.4.
- biapy.utils.util.make_weight_map(label, binary=True, w0=10, sigma=5)[source]
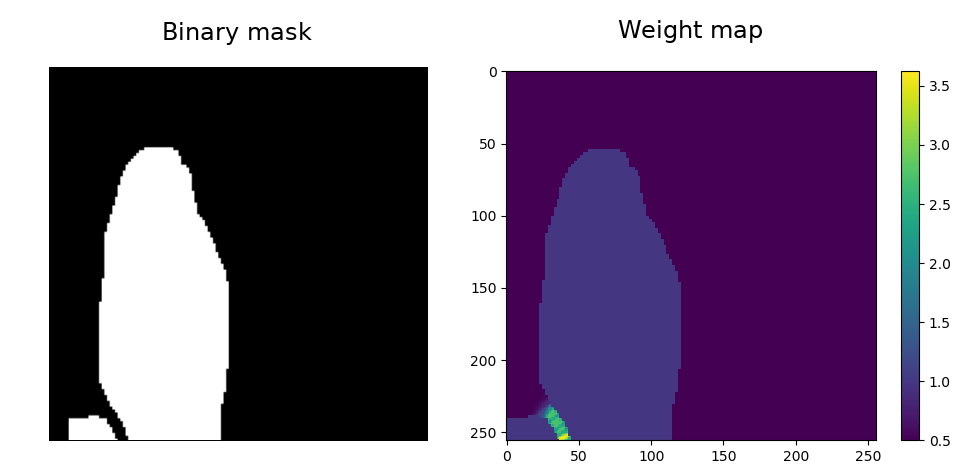
Generate a weight map for semantic segmentation, particularly useful for separating tightly packed objects, following the methodology of the original U-Net paper.
The weight map W(x) is a sum of two components:
A class balancing map W_c(x): assigns higher weight to foreground pixels.
A distance-based map: w0 * exp(-((d1 + d2)^2) / (2 * sigma^2)). This component is high near boundaries between touching objects, where d1 is the distance to the closest object and d2 is the distance to the second closest object.
Based on unet/py_files/helpers.py.
- Parameters:
label (NDArray) – A 2D or 3D NumPy array representing a label image. If 3D, it’s assumed to be (y, x, channels) and only the first channel is used. Objects are typically labeled with unique positive integers, background is 0.
binary (bool, optional) – If True, the input label is treated as a binary mask (0 for background, >0 for foreground) and then distinct objects are extracted. If False, it’s assumed label already contains distinct object IDs (or 0/1 for binary). Defaults to True.
w0 (float, optional) – Weight factor controlling the importance of the distance-based component for separating tightly associated entities. Defaults to 10.
sigma (int, optional) – Standard deviation of the Gaussian function used in the distance-based component. Controls the spread of the boundary weights. Defaults to 5.
- Returns:
A 2D NumPy array representing the generated weight map, with the same spatial dimensions as the input label.
- Return type:
NDArray
Examples
>>> # Assuming 'label_image' is a 2D NumPy array with object labels
>>> # weight_map = make_weight_map(label_image, binary=True, w0=10, sigma=5)
Notice that weight has been defined where the objects are almost touching each other.
- biapy.utils.util.do_save_wm(labels, path, binary=True, w0=10, sigma=5)[source]
Generate weight maps for a batch of label images and save them as NumPy files.
This function iterates through a 4D array of label images, applies the make_weight_map function to each, and saves the resulting weight maps into a specified directory structure.
Based on deepimagejunet/py_files/helpers.py.
- Parameters:
labels (NDArray) – A 4D NumPy array of label images, typically (num_of_images, y, x, channels).
path (str) – The base directory where the weight maps should be saved. A subdirectory named “weight” will be created within this path.
binary (bool, optional) – Corresponds to whether or not the labels are binary, passed to make_weight_map. Defaults to True.
w0 (float, optional) – Controls the importance of separating tightly associated entities, passed to make_weight_map. Defaults to 10.
sigma (int, optional) – Represents the standard deviation of the Gaussian used for the weight map, passed to make_weight_map. Defaults to 5.
- biapy.utils.util.foreground_percentage(mask, class_tag)[source]
Calculate the percentage of pixels in a given mask that correspond to a specific class.
- Parameters:
mask (NDArray) – A 2D or 3D NumPy array representing an image mask. If 3D, it’s assumed to be (y, x, channels) and only the first channel is used.
class_tag (int) – The integer label of the class to count.
- Returns:
The percentage of pixels labeled as class_tag in the mask, as a value between 0.0 and 1.0.
- Return type:
float
- biapy.utils.util.divide_images_on_classes(data, data_mask, out_dir, num_classes=2, th=0.8)[source]
Organize images into class-specific folders based on the percentage of foreground pixels belonging to each class in their corresponding masks.
For each class, a subdirectory is created. An image and its mask are saved into a class’s folder if the percentage of pixels labeled as that class in the mask exceeds a given threshold.
- Parameters:
data (NDArray) – A 4D NumPy array of input images, typically (num_of_images, y, x, channels). Only the first channel data[:,:,:,0] is used for saving.
data_mask (NDArray) – A 4D NumPy array of corresponding mask images, typically (num_of_images, y, x, channels). Only the first channel data_mask[:,:,:,0] is used for analysis and saving.
out_dir (str) – The base path where the class-specific folders (“x/classX” and “y/classX”) will be created and images saved.
num_classes (int, optional) – The total number of classes to consider (from 0 to num_classes - 1). Defaults to 2.
th (float, optional) – The minimum percentage (between 0.0 and 1.0) of pixels that must be labeled as a specific class in a mask for its corresponding image and mask to be saved into that class’s folder. Defaults to 0.8.
- biapy.utils.util.save_filters_of_convlayer(model, out_dir, l_num=None, name=None, prefix='', img_per_row=8)[source]
Create and save an image visualizing the filters learned by a specific convolutional layer within a Keras model.
The layer can be identified by its numerical index (l_num) or its name (name). If both are provided, name takes precedence. The filters are normalized to 0-1 for visualization and arranged in a grid.
- Parameters:
model (Any) – The Keras Model object containing the layers.
out_dir (str) – The directory where the output image will be stored.
l_num (Optional[int], optional) – The numerical index of the convolutional layer to extract filters from. Defaults to None.
name (Optional[str], optional) – The name of the convolutional layer to extract filters from. Defaults to None.
prefix (str, optional) – A string prefix to add to the output image filename. Defaults to “”.
img_per_row (int, optional) – The number of filters to display per row in the output image grid. Defaults to 8.
- Raises:
ValueError – If neither l_num nor name is provided.
Examples
To save the filters learned by the layer called
conv1one can call the function as followssave_filters_of_convlayer(model, char_dir, name="conv1", prefix="model")
That will save in
out_diran image like this: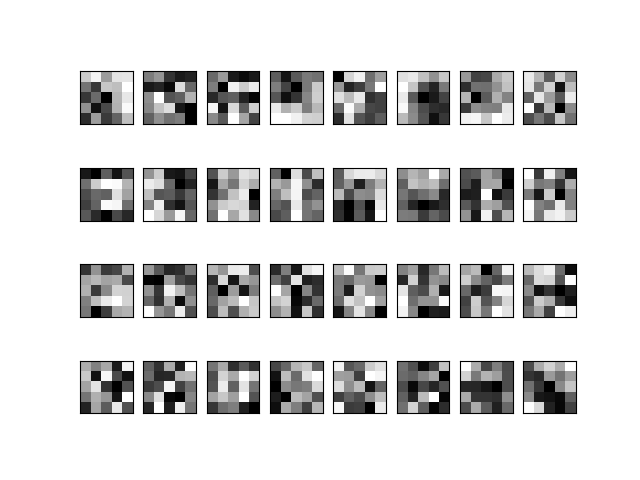
- biapy.utils.util.check_downsample_division(X, d_levels)[source]
Ensure that the spatial dimensions of a 4D NumPy array X are divisible by 2 raised to the power of d_levels. Padding is applied if necessary.
This is crucial for U-Net like architectures or other models that perform multiple levels of downsampling (e.g., pooling layers).
- Parameters:
X (NDArray) – The input data, a 4D NumPy array with shape (num_images, height, width, channels).
d_levels (int) – The number of downsampling levels (e.g., if d_levels=3, dimensions must be divisible by 2^3 = 8).
- Returns:
X_padded (NDArray) – The padded data, with spatial dimensions divisible by 2^d_levels.
original_shape (Tuple[int, …]) – The original shape of the input X.
- biapy.utils.util.seg2aff_pni(img, dz=1, dy=1, dx=1, dtype: ~numpy.dtype[~typing.Any] | None | type[~typing.Any] | ~numpy._typing._dtype_like._SupportsDType[~numpy.dtype[~typing.Any]] | str | tuple[~typing.Any, int] | tuple[~typing.Any, ~typing.SupportsIndex | ~collections.abc.Sequence[~typing.SupportsIndex]] | list[~typing.Any] | ~numpy._typing._dtype_like._DTypeDict | tuple[~typing.Any, ~typing.Any] = <class 'numpy.float32'>)[source]
Transform a 3D segmentation mask into a 3D affinity graph (4D tensor).
The affinity graph has 3 channels corresponding to affinities in the z, y, and x directions. An affinity value is 1 if two adjacent voxels (at specified distances dz, dy, dx) belong to the same segment (and are not background, i.e., label > 0), and 0 otherwise.
Adapted from PyTorch for Connectomics: https://github.com/zudi-lin/pytorch_connectomics/commit/6fbd5457463ae178ecd93b2946212871e9c617ee
- Parameters:
img (NDArray) – A 3D NumPy array representing an indexed image, where each index corresponds to a unique segment. Background is typically 0.
dz (int, optional) – Distance in voxels in the z (depth) direction to calculate affinity from. Must be less than img.shape[-3]. Defaults to 1.
dy (int, optional) – Distance in voxels in the y (height) direction to calculate affinity from. Must be less than img.shape[-2]. Defaults to 1.
dx (int, optional) – Distance in voxels in the x (width) direction to calculate affinity from. Must be less than img.shape[-1]. Defaults to 1.
dtype (DTypeLike, optional) – The desired data type for the output affinity map. Defaults to np.float32.
- Returns:
ret – A 4D NumPy array representing the 3D affinity graph, with shape (3, D, H, W) where the first dimension corresponds to z, y, x affinities.
- Return type:
NDArray
- Raises:
AssertionError – If dz, dy, or dx are zero or exceed the corresponding image dimension.
- biapy.utils.util.im2col(A, BSZ, stepsize=1)[source]
Implement the im2col (image to column) operation, which extracts sliding windows (patches) from an input 2D array and arranges them as columns in a new 2D array.
This is a common operation in convolutional neural networks for efficient convolution implementation.
- Parameters:
A (NDArray) – The input 2D NumPy array (image).
BSZ (Tuple[int, int]) – A tuple (patch_height, patch_width) specifying the size of the sliding window.
stepsize (int, optional) – The stride (step size) for sliding the window. Defaults to 1.
- Returns:
A 2D NumPy array where each row is a flattened patch from the input A.
- Return type:
NDArray
- biapy.utils.util.seg_widen_border(seg, tsz_h=1)[source]
Widen the border of segments in a label image by marking pixels as background if they are at the boundary between two different segments.
This is based on Kisuk Lee’s thesis (A.1.4): “we preprocessed the ground truth seg such that any voxel centered on a 3 x 3 x 1 window containing more than one positive segment ID (zero is reserved for background) is marked as background.”
- Parameters:
seg (NDArray) – The input label image (2D or 3D NumPy array). Background is 0, segments are positive integers.
tsz_h (int, optional) – Half-size of the square/cube window used to check for multiple segment IDs. A tsz_h=1 corresponds to a 3x3 (or 3x3x3 for 3D) window. Defaults to 1.
- Returns:
The label image with widened segment borders (boundary pixels set to 0).
- Return type:
NDArray
- biapy.utils.util.create_file_sha256sum(filename: str) str[source]
Calculate the SHA256 checksum of a given file.
This function reads the file in chunks to efficiently compute the hash, even for large files, without loading the entire file into memory.
- Parameters:
filename (str) – The path to the file for which to calculate the SHA256 sum.
- Returns:
The hexadecimal SHA256 checksum of the file.
- Return type:
str
- biapy.utils.util.get_cfg_key_value(obj, attr, *args)[source]
Recursively retrieve a nested attribute value from an object (e.g., a YACS CfgNode).
This function allows accessing values from nested configuration objects or any object with attributes, by providing a dot-separated string for the attribute path. It’s particularly useful for navigating CfgNode objects.
- Parameters:
obj (object) – The base object from which to start attribute retrieval.
attr (str) – A dot-separated string representing the path to the desired attribute (e.g., “MODEL.ARCHITECTURE”, “DATA.PATCH_SIZE.0”).
*args – Optional arguments to pass to getattr for default values if an attribute is not found. If provided, getattr(obj, name, *args) is used.
- Returns:
The value of the nested attribute.
- Return type:
any
- Raises:
AttributeError – If an attribute in the path does not exist and no default value is provided.